Student Enrollment Journey


The Student Enrollment Journey (metrics that matter, and will improve with study)

Infographic of Enrollment Journey
Those familiar with my work know I champion the enrollment scoreboard as a higher education brand’s most vital tool for team inspiration. This article draws upon the insightful UPCEA + InsideTrack whitepaper, which reveals national averages based on survey data. While these averages offer valuable benchmarks, I firmly believe that every institution can gain a significant advantage by tracking their unique enrollment numbers and making those metrics a focal point of strategic discussions.
By visualizing progress toward enrollment goals with a Scoreboard, you unlock its power to:
- Tell a compelling story: Clearly illustrate your institution’s enrollment journey and achievements.
- Unify stakeholders: Align teams around a shared goal and foster a sense of collective ownership.
- Drive action: Motivate everyone to work collaboratively towards the ultimate objective: enrolling and graduating students who become successful alumni.
TL;DR
This article is inspired by the key findings from the UPCEA + InsideTrack whitepaper, “LOOKING TOWARD THE FUTURE: Enrollment Strategies and Evolving Expectations of Potential Inquirers.”
SOURCE: insidetrack.org/reports/enrollment-strategies-and-evolving-expectations-of-potential-inquirers
Highlights
- Average Journey Duration: The typical student journey takes 117 days (3.9 months) from initial inquiry to enrollment.
- Time to Engage: If we turn back the clocks 3.9 months from College Decision Day on May 1st, the months of December/January as primetime to anticipate an upswing in inquiry activity for traditional fall enrollment.
- Journey Stages: The process unfolds through Inquiry, Begin Application, Complete Application, Acceptance, and Enrollment.
- Inquiry / Begin Application – the Biggest Drop-Off: The largest attrition occurs between Inquiry and Begin Application, with a 37% conversion rate (a significant 14-point increase compared to 23% in 2019).
- Application Completion Rate: Half of the students who start an application successfully complete it.
- 1 out of 10 students who submit an inquiry flow through the stages and complete their enrollment (not accounting for stealth applications)
- Overall Inquiry to Matriculation Funnel Rate is 10.4%
- By understanding your school’s conversion rates at each stage of the journey, you can identify and optimize the friction points across the enrollment process.

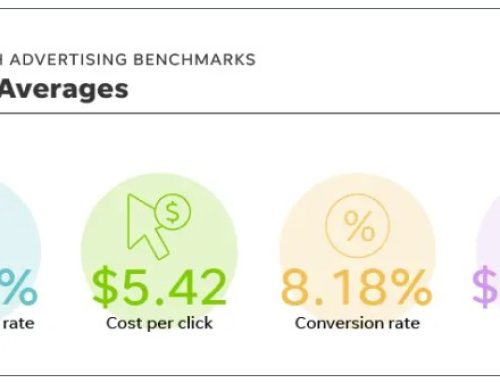
Average Conversion Rates for Enrollment Funnel Stages
Before the funnel, there were marketing campaigns..

The impact of marketing campaigns is everything to the left of the opening bracket
Before we begin our deep dive into the five stages of the enrollment funnel, I want to take a moment and highlight the critical role that marketing plays in the early stages of the higher education journey. Years of meticulously crafted branding and targeted marketing campaigns by college marketing teams and advertising agencies pave the way for prospective students to arrive at a school’s website and initiate their decision-making process. These campaigns are designed to spark interest, foster connections, and showcase the unique value of an institution, ultimately shaping the final decision on where a student declares their intent to enroll.
The path to enrollment is the culmination of these concerted efforts, designed to create a lasting impression and nurture potential students’ aspirations. As students and their families navigate the overwhelming array of college options, these early interactions with a school’s brand often serve as a guiding light, leading them to a pivotal moment: their first inquiry. This action marks the official entry into the enrollment funnel, a multi-stage process depicted in the infographic above.
Understanding the impact of these pre-funnel marketing efforts is paramount. These campaigns, spanning years of cultivating brand awareness and engaging potential students, play a pivotal role in attracting inquiries and ultimately driving enrollment decisions.
Now that our marketing team is enjoying some deserved validation, let’s study each stage of the enrollment funnel and examine in exhausting detail, so we may uncover potential opportunities to optimize the journey, together.

CHAPTER 1
Inquiry
With thoughtful and effective campaigns delivering to both parents and students across our target geography, the game is afoot. The view from the Inquiry stage allows us to see our final destination in the distance, and here we should survey the landscape prepare to venture across. This moment represents the true first impression, and how we first meet will color the entire experience.
Reaching the final stage of enrollment is not solely based upon a student’s decision or preference, but is often linked to the level of engagement and involvement on the part of the college or university throughout each phase of the funnel. (UPCEA & InsideTrack, 2023)

Funnel view calculating yield of 1,000 prospective students based on average conversion rates

Let’s see how 1,000 inquiries calculate with the average conversion rates between stages…
Skipping the Queue
Some prospective students are electing to skip the Inquiry stage and the first record they are interested in your school is when their application is submitted, removing your recruiters the opportunity to build strong connection.

Stealth Applications are prospects that Apply without Inquiry on your website

CHAPTER 2
Begin Application
Let’s zoom in specifically on what happens after our compelling marketing campaigns prompt a potential student to visit our website and submit an inquiry for more information..
In 2023, on average, only 37% of individuals who inquired about a specific program progressed to the next stage of the journey by beginning an application — a 14-point increase from 23% in the 2019 survey.
This conversion point surprised me.

Inquiry to Begin Application
To put this opportunity into context, six out of ten prospective students drop off at this stage of the journey. Capitalizing on this could have an outsized impact on the entire student enrollment process and unlock crucial insights into how we can improve our personal connections with students during this critical moment of school selection.
A couple of key questions to consider when optimizing your RFI experience:
- What is the inquiry-to-application conversion rate for your brand?
- What are the top three questions potential students ask in RFIs?
- Have you ‘secret shopped’ your RFI experience?

CHAPTER 3
Complete Application, Accepted, Enrolled
Now we have reached the true Scoreboard that represent the most important metrics to gauge our progress.
- How many applications did we receive?
- Of those applications, how many did we accept?
- Of those we accepted, how many declared their intent to enroll?
Enrollment

Overall Matriculation Rate

FINALE
Closing Thoughts…
Power of the Scoreboard
- Knowing your brand’s numbers across all stages of the funnelis one of the most powerful practices to master.
- This context of where we are now and the distance needed to travel to achieve the goal is the north star. The fastest way to improve a metric is by tracking it over time
- The building of a sharable Scoreboard unlocks better storytelling across all teams, including your marketing teams, enrollment team, leadership and agency partners.
Try the Experience, then Optimize
- Secret shop your enrollment funnel to experience the journey first-hand from submitting an Inquiry on the website to engaging with recruitment team.
- Find areas to improve the experience and reduce friction for prospective students. Improving a conversion rate a few percentage points may have pay dividends
- Make it easy for prospective students to enter your CRM so your team can begin building a connection by requesting they share minimal personal data. The lower your stealth applications, to better chance you have to build brand and provide support that increases overall enrollments
- Leverage the data sets you’ve collected from prior years RFI submissions.
- What are the top three questions asked?
- What fields can be removed / updated to increase submissions?


OUR LATEST WHITEPAPER
3rd Annual Parent & Student Survey
The New Rules Of Higher Education Marketing
How AI and Shifting Family Priorities are Reshaping Student Recruitment
AI isn’t new. It’s normal. Students and parents alike are increasingly using LLMs for research – for everything from homework help to their best options for higher education. If families already use AI to choose, the question is: how is your institution meeting them there? Our latest whitepaper outlines how to publish AI-readable answers to the most asked questions, making your value legible to both humans and machines.